These are the hardest places for minimum wage workers to live
By Ana Swanson
September 14 at 7:00 AM - The Washington Post
You might have a rough sense that workers who earn the minimum wage in America aren't making enough to cover the cost of a decent living. But how big is that gap really?
A professor at MIT created a new interactive map that shows where it's hardest for those earning the minimum wage to get by. Amy Glasmeier created a tool called "The Living Wage Calculator," which shows the hourly rate that an individual needs to earn to support their family for every county in the country. She then used the information to create the map pictured below, which shows the difference between the minimum wage and the amount of money needed to meet a minimum standard of living around the U.S. (You can click on the map to enlarge it.)
MIT, Living Wage Map
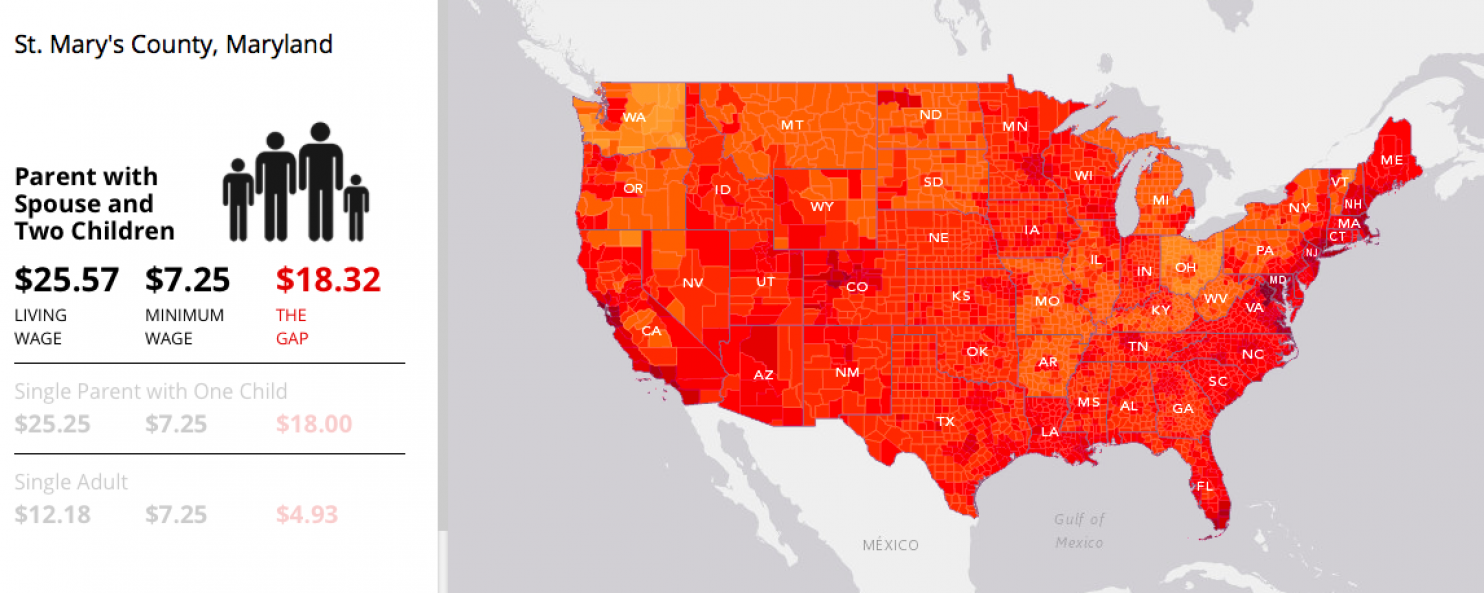
The interactive map lets you look at how the gap between the minimum wage and a "living wage" differs for a single adult, a single parent with one child, and a parent with a spouse and two children, for different regions around the U.S. The darker red areas indicate a large gap between what someone makes earning the minimum wage and what they need to survive, while the orange areas are a smaller gap.
Glasmeier defines the living wage as the amount needed to cover basic family expenses, including food, child care, insurance, health care, housing, transportation and taxes. She draws the estimates for these costs from official sources, including the U.S. Department of Agriculture and the Bureau of Labor Statistics. She then divides that total over a work-year of 2,080 hours (52, 40-hour work weeks) to estimate the "living wage," what people need to earn per hour to afford these basic necessities.
There are a few reasons this gap varies around the country, Glasmeier says. Often cities will tend to have much higher costs of living, creating large gaps in urban areas even if the minimum wage there is relatively high. In rural areas, however, a relatively low minimum wage is more likely to come closer to meeting a family's basic needs.
The map shows that the East Coast, especially the high-cost urban areas of Washington and New York, are some of the most challenging places for minimum-wage workers to make ends meet. Here is what the map looks like for single parents with one child living in cities around the U.S.:
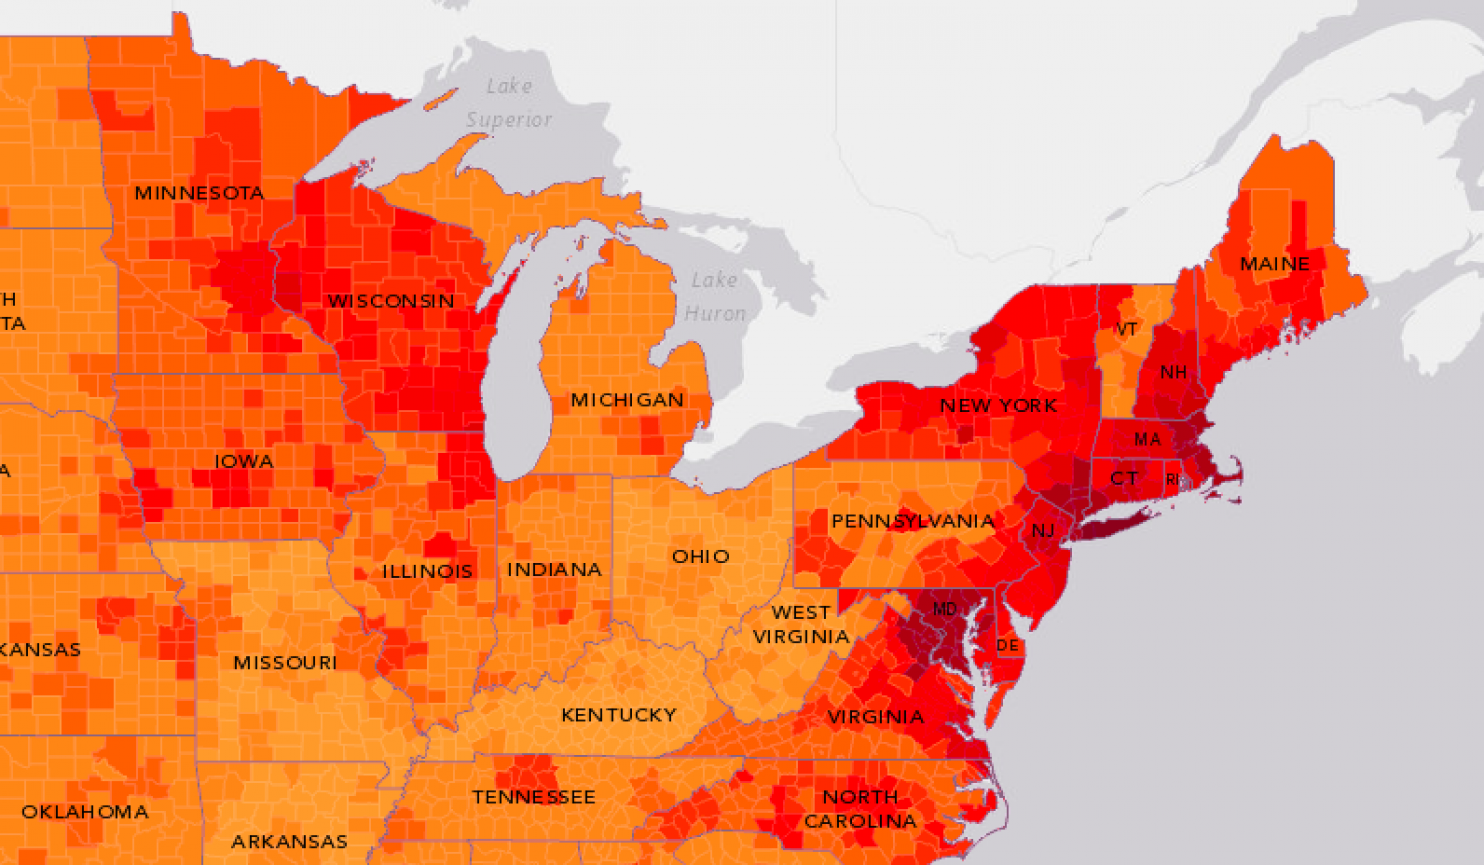
In Washington, a living wage for a single parent with one child is $30.36, while the minimum wage is only $9.50, leaving a gap of $20.86. Unsurprisingly, the Bay Area also shows up as relatively unaffordable by this measure.

Perhaps more surprisingly, the map shows that life is relatively hard for those earning the minimum wage in Wisconsin, Colorado, New York, Florida and Maine.
Regardless of where you are in the country, urban areas tend to be pretty expensive. Here is the same data, for a single parent with one child, in urban areas in the U.S.:

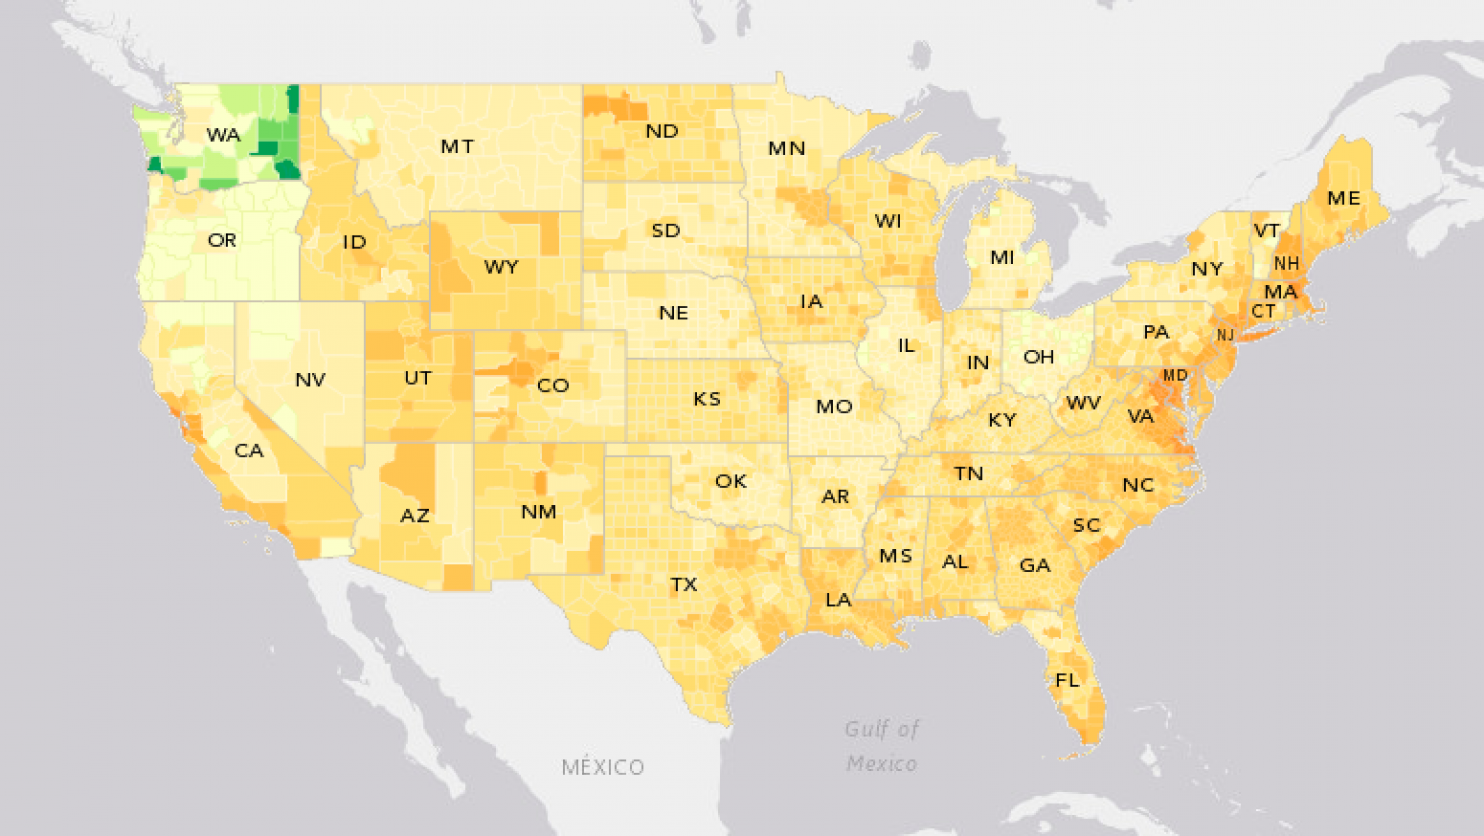
For single adults with no children, things look more affordable, though there is still a gap.
The only state in which there is not a gap is Washington State, where in some places (shown in green below) the cost of living is actually lower than the minimum wage. For minimum wage workers in the U.S., it's a rare exception.
Try out the map for yourself here.